The summer commodity price for corn and soybeans is largely determined by events that happen in April and May. Not entirely, because July weather in the Corn Belt can override any planting-season advantage or deficit. But a procurement team that waits until June or July to start assessing summer supply risk has already missed the signal window that determines whether forward contracts should have been placed in May.
This article explains what the April and May planting data actually tell you, how NDVI satellite readings add resolution to the USDA survey-based reports, and what a 60-to-90 day forward window into summer prices looks like when these signals are read correctly.
USDA Planting Progress: What the Weekly Numbers Mean
USDA's Weekly Crop Progress report, published every Monday afternoon from early April through November, includes a section that shows the percentage of intended corn and soybean acres that have been planted as of the prior Sunday. The weekly figure is compared to the same week in the prior year and to the five-year average for that date.
The five-year average is the reference that matters most for supply forecasting purposes. When planting pace runs meaningfully behind the five-year average, it signals one of two things: either conditions (soil temperature, soil moisture, weather) have delayed field activity, or intended plantings may be switched to later-maturing varieties or alternative crops. Both scenarios carry supply implications for the summer growing season.
The critical threshold most agronomists and grain analysts watch for corn is the percentage of acres planted by the date that corresponds to a meaningful yield drag from late planting. For Corn Belt corn, this is roughly the first week of May in the southern Belt (Illinois, Indiana, Ohio) and mid-May in the northern Belt (Minnesota, Iowa, South Dakota). A crop that is substantially behind average planting pace by these dates is at material yield risk regardless of how the summer weather develops.
Soybeans have more planting flexibility than corn: they can be planted later and still achieve strong yields, which is why soybeans are sometimes the recipient of late-planted corn acres that miss the yield-optimal planting window. But soybeans planted after early June in the Corn Belt face shortening growing season constraints, and a planting season that runs very late for soybeans also has summer price implications.
Reading the State-Level Breakdown
The national planting progress figure is an average. State-level figures, also published weekly, show where the deviation is concentrated. A national figure of 60% planted that masks Kansas and Iowa at 45% planted (the two largest corn states) is a substantially more bearish supply signal than a national 60% driven by late progress in Missouri (a smaller producing state).
When reviewing the weekly crop progress release, the state-level breakdown for the top corn and soybean producing states should be the starting point: Iowa, Illinois, Indiana, Ohio, Minnesota, Nebraska, South Dakota, and Kansas for corn; Iowa, Illinois, Minnesota, Indiana, and Nebraska for soybeans. A multi-week deficit in these states, particularly if accompanied by adverse weather forecasts, is a meaningful summer supply risk signal.
NDVI: Satellite Ground Truth for Crop Development
The Normalized Difference Vegetation Index (NDVI) is a satellite-derived measure of green plant biomass density. It is calculated from the ratio of red and near-infrared light reflectance from the Earth's surface, and it provides an objective, spatially detailed view of crop emergence and early growth that USDA's survey-based condition ratings cannot match in resolution.
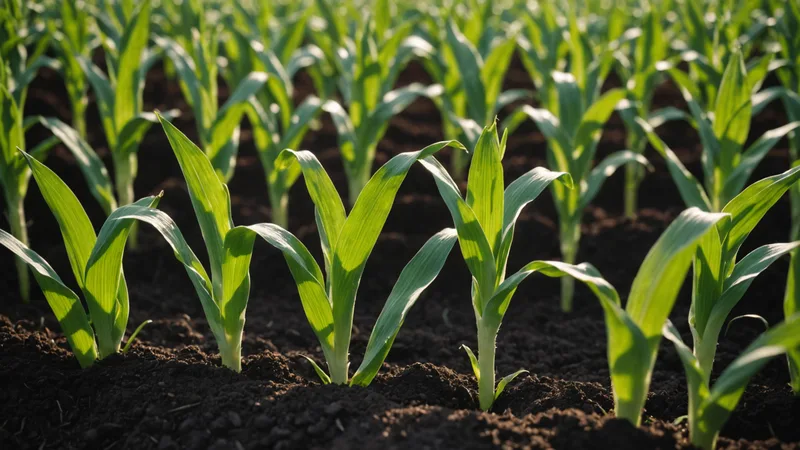
NDVI data from MODIS and Sentinel satellite platforms is available at resolutions ranging from 250 meters to 10 meters, allowing analysts to assess not just state-level or county-level crop development but field-level variation. A county showing below-average NDVI in mid-May, during the period when corn should be at V3 to V5 growth stage, is a county with either delayed planting, poor emergence, or early crop stress. Multiple counties in a state showing below-average NDVI simultaneously is a state-level signal.
For a procurement team, NDVI is most valuable during the six-week period from late April through late May. Before that window, there is insufficient crop development to produce a meaningful NDVI signal. After that window, the USDA condition ratings catch up and provide an adequate (if lower-resolution) view of crop health. The May NDVI data fills the gap between the planting progress figures (which tell you how much has been planted) and the condition ratings (which tell you how the crop looks once it is in the ground).
Translating the April-May Signals into a Summer Price Forward View
Consider a simplified example to illustrate the translation logic. It is mid-May. USDA planting progress for corn in Iowa, Illinois, and Indiana is running 12 to 15 percentage points behind the five-year average due to persistent cold and wet soil conditions. NDVI in the same states, where planting has occurred, shows below-normal emergence vigor. NOAA's 30-day outlook shows above-normal precipitation probability continuing for the central Corn Belt through early June.
What does this signal about summer corn prices? First, a meaningful portion of Corn Belt corn acres are likely to be planted late, carrying an embedded yield drag that does not require any additional weather stress to materialize. Second, late-planted acres are also more vulnerable to early fall frost if August temperatures run below normal. Third, the wet conditions that have delayed planting often compress the planting window into a short period in late May or early June, during which planting quality can suffer (soil compaction from wet field conditions, inadequate seed-to-soil contact from rushed field prep).
This does not mean prices will spike by July. Supply is a global balance, and US Corn Belt conditions are one input into that balance alongside South American harvest results, global demand, and inventory levels. But it does mean the probability of a below-average US corn crop has elevated materially from what the April futures curve was pricing when planting intentions were assumed to be fully on schedule.
We are not suggesting that a May NDVI reading lets you call the final corn yield with precision. The growing season runs through August, and a dry May can be followed by an ideal June-August that produces a full crop. What we are saying is that the May planting and development signals provide the best early-season evidence you will have about the probability of below-average supply. A procurement team that is not watching them is flying partially blind through the most information-rich period of the crop year calendar.
Connecting the Signal to Procurement Timing
The practical question is when to act on the planting-season signal. Most corn procurement for summer delivery happens in contracts negotiated in the April-June window. A procurement team that has monitored the planting progress and NDVI data through May and observed building supply risk has a narrowing window to increase forward coverage before the signal is fully priced.
This does not require mechanically buying more whenever planting is slow. It requires factoring the planting-season supply risk into the procurement coverage decision alongside other inputs: current price levels, budget constraints, and the degree to which the risk has already been priced into the forward curve. An elevated supply-risk score combined with a forward curve that still reflects an optimistic supply view is the highest-urgency combination for a procurement team to act on.
The 60-to-90 day forward window that April and May data provides is genuinely actionable. It is long enough to make coverage decisions before prices fully move, and short enough that the signals are directly relevant to the specific harvest season in question. For a procurement team managing forward corn or soybean exposure, it is arguably the most consequential data window in the calendar year.